What I Saw Last Week
U.S. Existing Home Sales dropped 0.6% month-over-month to a seasonally adjusted annual rate of 5.38 million units in June – I had forecast a modest increase to 5.43 million.
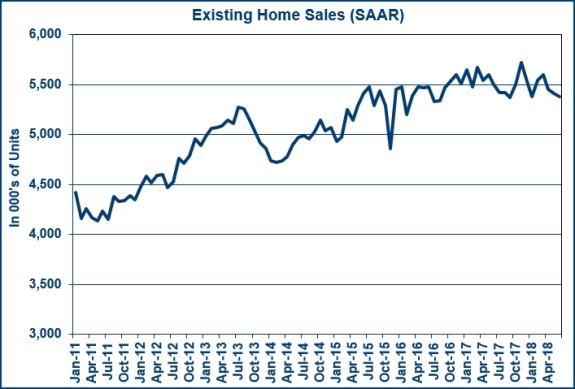
The number was clearly a disappointment, but not all markets saw a contraction in sales. As the Northeast of the country saw sales rise by 5.9% and the Midwest eked out a 0.8% increase. The total number fell due to a 2.2% drop in the South and a 2.6% drop in the West.
The median existing home price for all housing types increased 5.2% to an all-time high of $276,900, which was the 76th straight month of year-over-year gains. The median existing single-family home price was $279,300, up 5.2% from a year ago.
Median home prices by region: Northeast (+3.3% to $305,900); Midwest (+3.5% to $218,800); South (+2.7% to $237,500); and West (+10.2% to $417,400).
The inventory of homes for sale at the end of June rose 4.3% to 1.95 million units, yet inventory was up 0.5% from a year ago. That said, it represents the first year-over-year increase since June of 2015.
Unsold inventory is at a 4.3-month supply at the current sales pace, versus 4.2 months a year ago and the 6.0-month supply typically associated with a more balanced market.
The takeaway from the report remains the same: notable supply constraints continue to act as a drag on overall sales. The limited inventory — and the high prices on available inventory — is crimping affordability, particularly for first-time buyers; moreover, all prospective buyers are feeling affordability pressures from home prices rising faster than income.
U.S. New Home Sales dropped 5.3% month-over-month in June to a seasonally adjusted annual rate of 631,000 units – I had forecast a far smaller drop to 670,000 units.
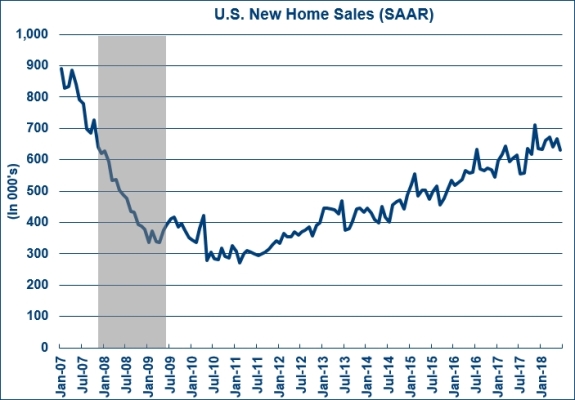
The median sale price dropped 4.2% year-over-year to $302,100 while the average sale price dropped 2.0% to $363,300. Based on the current sales pace, the inventory of new homes for sale increased to a 5.7-months’ supply, versus 5.3 months in May and 5.3 months in June of 2017.
The takeaway from the new homes report is that the June decline represented the largest monthly drop since December, and it took place despite a decline in median and average selling prices. That said, and Despite the disappointing June estimate, total sales for the first half of 2018 (349,000) were 6.9% higher than the comparable total for 2017 (327,000). I expect the volume of new home sales to continue to expand along the current modest pace, subject to monthly volatility and supply-side cost concerns.
The first estimate for GDP in Q-2 exactly matched my forecast for economic growth of 4.1% and Q-1 growth was revised up to 2.2% (from 2.0%).
The rate of growth was the fastest seen since the 3rd quarter of 2014 and the third-best growth rate since the Great Recession.
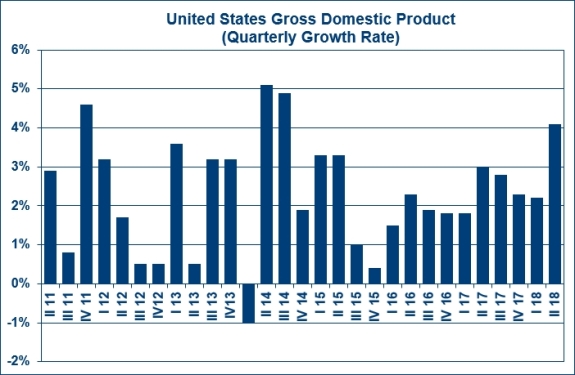
In addition to the rise in consumer and business spending, increases in exports and government spending also helped. Personal consumption expenditures rose 4% while business investment grew 7.3% and federal government outlays increased by 3.5%.
In as much as the number was very good, and the administration should be given credit, I do not see how the country can continue to expand at this rate. My belief is that business investment was boosted by corporate tax breaks and is unlikely to continue. Additionally, exports (up by 9.3%) rose as farmers rushed to get soybeans (sales up over 9,400%) to China ahead of expected retaliatory tariffs to take effect in the coming days.
Ultimately, tariffs and last year’s massive tax cut were key factors in the growth.
The final Consumer Sentiment number for July came in at 97.9 (I had forecast 97.1) up from the preliminary reading of 97.1.
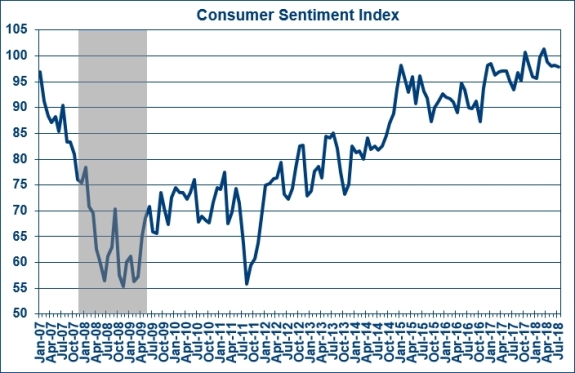
The Current Economic Conditions Index was revised to 114.4 from 113.9 while the Index of Consumer Expectations was revised to 87.3 from 86.4.
The takeaway from the report is that confidence remained at high levels due to favorable job and income prospects, offsetting growing concerns it seems about the potential impact of tariffs on the domestic economy.
What to Watch for This Week
The NAR Pending Home Sales Index for June should show very modest improvement from the 0.5% contraction seen in May. I am hoping to see an increase of 0.2%.
Income & Spending for June will be positive with incomes up by 0.4% and spending 0.5% higher.
Case Shiller Index numbers for May should show the 20-City Index up by 6.5%, just below the 6.6% seen in April.
Consumer Confidence in June was measured at 126.4 and the July number should come in at 126.6.
U.S. Construction Spending rose by 0.4% in May and the June number is likely to show an expansion of 0.2%.
The jobs report for July comes out on Friday and I expect to see Non-Farm Payrolls up by 190.000, down from the 123,000 jobs that were added in June, and the Unemployment Rate is likely to drop from 4.0% to 3.9%.
