What I Saw Last Week
Inflation – as measured by the Consumer Price Index – exactly matched my forecast with an increase of 0.3% and the core rate also met my forecast for an increase of 0.2%.
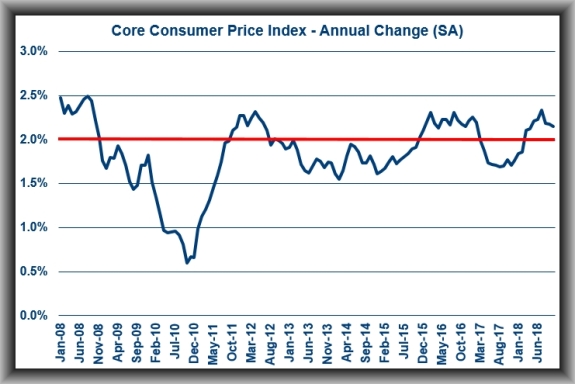
On a year-over-year basis, the all items index was up 2.5%, versus 2.3% in September, and core CPI was up 2.1% versus 2.2% in September.
A 3.0% increase in the gasoline index was responsible for about one-third of the increase in the all items index while a 0.2% increase in the shelter index and a 2.6% increase in the index for used cars and trucks were drivers of the uptick in the index that excludes food and energy (“core CPI”).
The takeaway from the report is that it points to a firming in consumer inflation, which fits the Federal Reserve’s inclination to raise rates again in December.
U.S. Retail Sales in October rose by 0.8% (I had forecast 0.6%) and core sales up by 0.7% (I had forecast 0.5%).
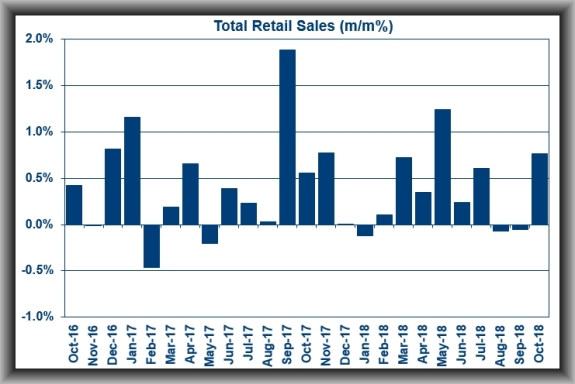
The only retail categories registering sales declines in October were furniture and home furnishing stores (-0.3%) and food services and drinking places (-0.2%).
The takeaway from the report is that it reflects healthy consumer spending activity that will provide a positive input for Q-4 GDP forecasts. Core retail sales, which exclude auto, gas station, building equipment and materials, and food services sales, jumped 0.3%.
What to Watch for This Week
The NAHB Housing Market Index for November is likely to drop from October’s number of 68 – look for it to come in at 66.
U.S. Housing Starts were running at an annual rate of 1.201 million in September and the October figure is likely to rise to 1.230 million.
U.S. Building Permits in September were measured at an annual rate of 1.260 million and the October figure is likely to show it growing to 1.260 million.
The final Consumer Sentiment number for November is likely to remain at the early month figure of 98.3.
U.S. Existing Home Sales should tick up from the annual rate of 5.15 million seen in September to 5.20 million units.
