The Weekly Economic & Real Estate Forecast – 12/17/18 to 12/21/18

What I Saw Last Week

As I had forecast, inflation – as measured by the Consumer Price Index – in November showed the overall rate unchanged and the core rate up by 0.2%.

CPI

Total CPI was up 2.2% year-over-year, versus 2.5% in October, and core CPI was up 2.2%, versus 2.1% in October.

The takeaway is that consumer inflation trends are not running away from the Federal Reserve’s longer-run target, which should feed into the market’s growing belief that the Federal Reserve has some data-based scope to take it easy after a December rate hike.

U.S. Retail Sales in November exactly matched my forecast for an increase of 0.2% with core sales (ex-auto) up by 0.2% (I had forecast an increase of 0.3%).

Retail sales

An important item to take into account is that there were sizable revisions to the October data for total retail sales (to 1.1% from 0.8%) and retail sales, excluding autos (to 1.0% from 0.7%). Those revisions should mitigate any sense of disappointment in the “mixed” report for November.

The takeaway from this report is that expanded core retail sales – which exclude gasoline stations, building materials, food services and drinking places sales, as well as auto sales – increased 0.9%. That’s important because this variable of core sales is used in the computation of the goods component for personal consumption expenditures in the GDP report.

What to Watch for This Week

The NAHB Housing Market Index plummeted from 68 to 60 in November and I expect that the December figure will show a very modest rebound and rise to 61.

U.S. Building Permits were running at an annual rate of 1.263 million units in October and the November number is likely to come in at around 1.270 million.

U.S. Housing Starts in October were measured at an annual rate of 1.228 million units and the November figure will show some improvement and show starts running at an annual rate of 1.230 million.

U.S. Existing Home Sales in October were measured at an annual rate of 5.22 million units. The November number are likely to show a further drop to 5.20 million.

The Federal Reserve meet this week to discuss interest rates and, even with the recent volatility in the equity markets are very likely to raise the Fed Funds Rate by a quarter point.

The third and final revision to U.S. GDP in Q-3 will show no adjustment to the second estimate of 3.5% annual growth.

U.S. Income & Spending in November should show incomes and spending both up by 0.3%.

NOTE: This will be my last forecast for 2018 as I head off for a much needed break.

I trust that you all have a very pleasant holiday season – hopefully with family and friends – and I look forward to continuing to share my economic and housing market forecasts with you in the New Year.

Happy Holidays, Everyone!

Matthew Gardner

Chief Economist, Windermere Real Estate

The Weekly Economic & Real Estate Forecast – 12/10/18 to 12/14/18

What I Saw Last Week

Total U. S. Construction Spending dropped by 0.1% in October following a downwardly revised 0.1% (from 0.0%)  in September.  I had forecast it to have risen by 0.3%.

Con Spend

Total private construction spending declined 0.4% in October. Residential spending fell 0.5%, led by a 0.5% drop in new single-family construction. Non-residential spending declined 0.3%, led by a 2.4% drop in power spending.

Total public construction spending increased 0.8%. Nonresidential spending jumped 0.7%, driven by a 2.6% increase in educational spending.

Total construction spending was up 4.9% year-over-year in October, with total residential spending up 1.7% and total nonresidential spending up 7.3%.

The takeaway from the report is that the weakness was driven by a decline in new single-family construction, providing further evidence of the softening in housing market activity.

November Non-Farm Payroll growth was lackluster with an increase of 155,000 (I had expected to see an increase of 185,000.)

Payrolls

Over the past three months, job gains have averaged 170,000 per month.  October non-farm payrolls revised to 237,000 from 250,000.  September non-farm payrolls revised to 119,000 from 118,000.

November private sector payrolls increased by 161,000 with October private sector payrolls revised up to 251,000 from 246,000 and September private sector payrolls revised down to 117,000 from 121,000.

Of note was that average hourly earnings were up 0.2% month-over-month leading to an annual increase of 3.1%

As I had anticipated, the U.S. Unemployment Rate held at 3.7%.

U Rate

Persons unemployed for 27 weeks or more accounted for 20.8% of the unemployed versus 22.5% in October. The U-6 unemployment rate, which accounts for unemployed and underemployed workers, was 7.6% versus 7.4% in October.

The labor force participation rate was 62.9% in November versus 62.9% in October.

The takeaway from the payroll and unemployment reports is that the wage acceleration the Federal Reserve has been bracing for was missing. That won’t likely keep the Federal Reserve from raising the target range for the fed funds rate at its December FOMC meeting, yet it’s the type of data point that could lead the Federal Reserve to be more cautious-minded about raising rates after that.

Consumer Credit rose by $25.4 billion in October – I had forecast a rise of $16.5 billion.

Creit

Non-revolving credit increased by $16.2 billion to $2.926 trillion while revolving credit increased by $9.2 billion to $1.037 trillion.

Consumer credit increased at a seasonally adjusted annual rate of 7.75% in October, with revolving credit increasing at an annual rate of 10.75% and non-revolving credit increasing at an annual rate of 6.75%.

The takeaway from the report is that the healthy expansion in consumer credit is a good portent for current and future consumer spending activity.

What to Watch for This Week

Inflation – as measured by the Consumer Price Index – in November should show the overall rate unchanged and the core rate up by 0.2%.

U.S. Retail Sales rose 0.8% in October and the November figures should show sales up by 0.2% and core sales (ex-auto) up by 0.3% (from 0.7% the prior month).

The Weekly Economic & Real Estate Forecast – 12/03/18 to 12/07/18

What I Saw Last Week

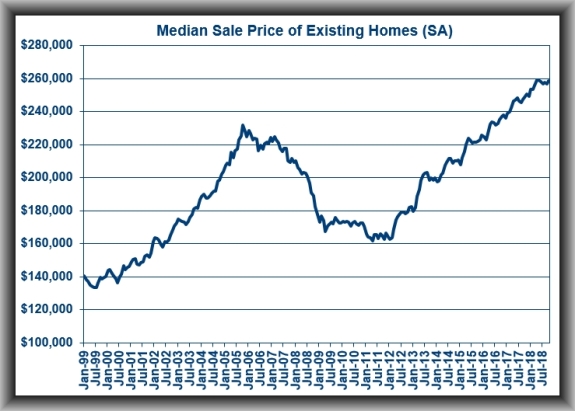
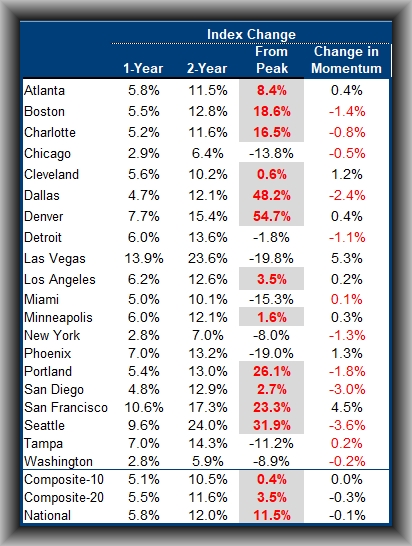
The Case Shiller Index number for September showed the 20-City Index level up by 5.1% year-over-year (I had forecast 5.3%)  – down from the August level of 5.5% as rising mortgage rates cut into affordability.

Notably, this growth rate is the lowest seen since November of 2016.

Separately, home prices plus data on house sales and construction also confirm the slowdown in housing.  One factor contributing to the weaker housing market is the recent increase in mortgage rates.  The average rate on the 30-year fixed mortgage is now a full percentage point higher than it was one year ago, and affordability has fallen to the weakest level in over a decade.

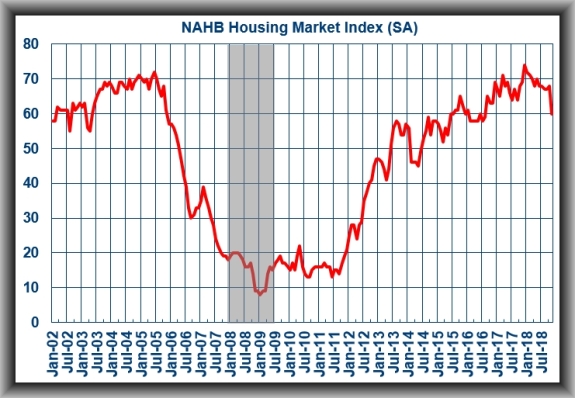
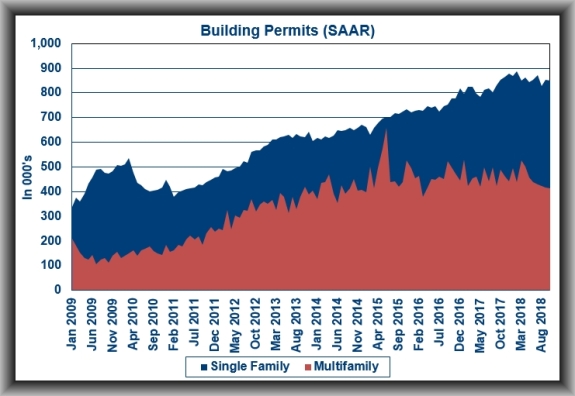
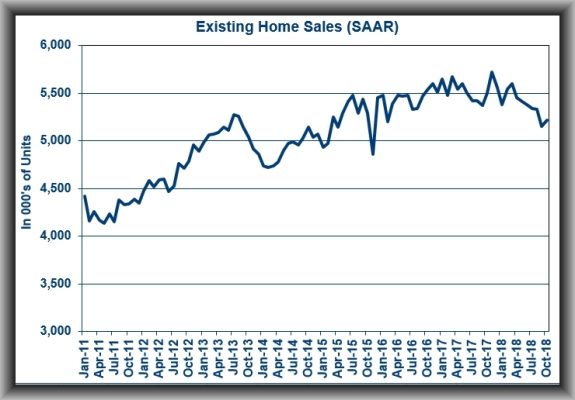
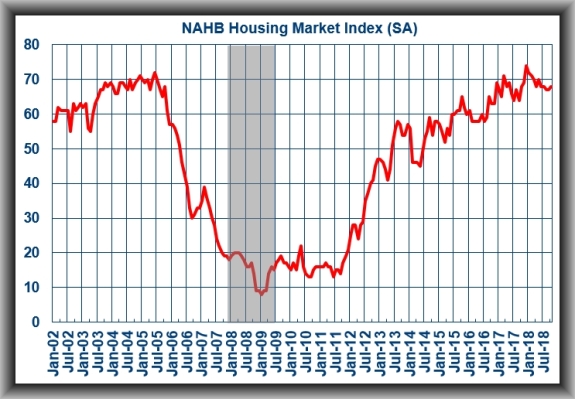
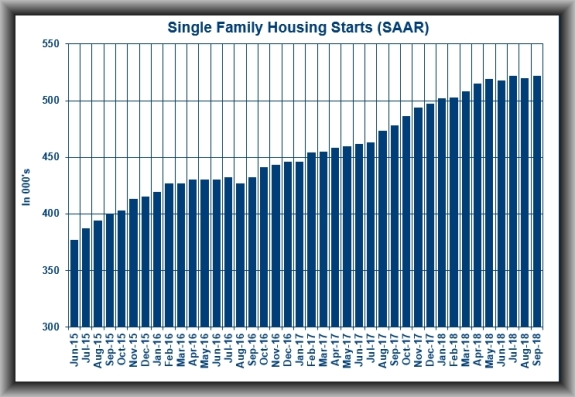
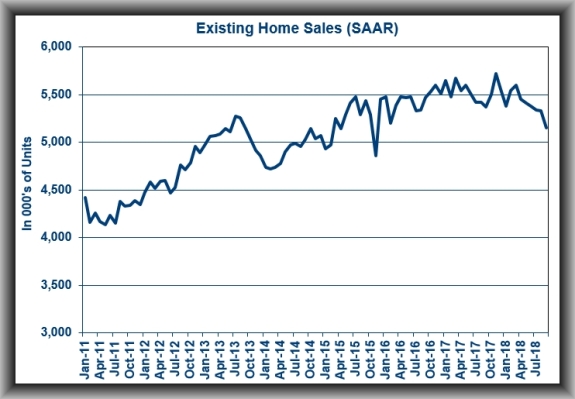
Sales of existing homes are down 9.3% from that peak and housing starts are down 8.7% from November of last year with the National Association of Home Builders sentiment index dropped seven points to 60, its lowest level in two years.

Cities that experienced the biggest price drops during the housing crash a decade ago are still seeing some of the biggest gains currently. Las Vegas, Phoenix and Tampa are still seeing home value gains increase.

Las Vegas, San Francisco and Seattle reported the highest year-over-year gains among the 20 cities. In September, Las Vegas prices jumped 13.5% annually. San Francisco values rose 9.9% and Seattle homes saw an 8.4% increase. Four cities in the 20-City Composite saw bigger annual increases in September than in August.

The takeaway from the report is home price growth is moderating and this trend will continue into 2019.

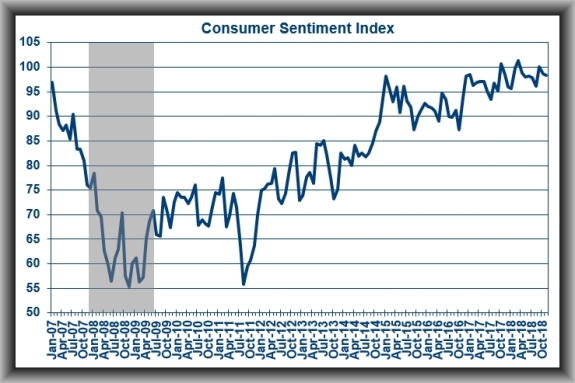
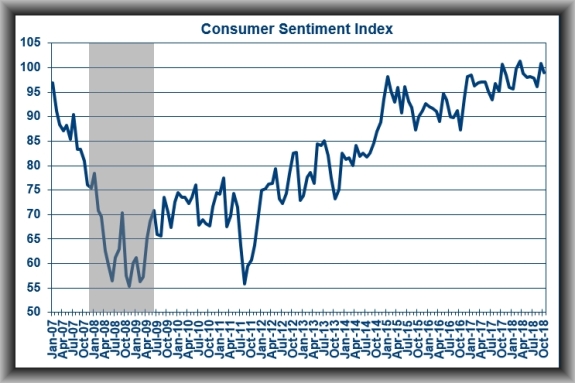
Consumer Confidence in November dipped from 137.9 to 135.7 – I had forecast a drop to 135.5.

The Present Situation Index increased from 171.9 to 172.7, bolstered by consumers’ assessment of job growth while the Expectations Index fell from 115.1 to 111.0 – pressured somewhat by a less optimistic view of future business conditions and personal income prospects.

The takeaway from the report is that consumer confidence remains at historically strong levels due in large part to positive views on the labor market.

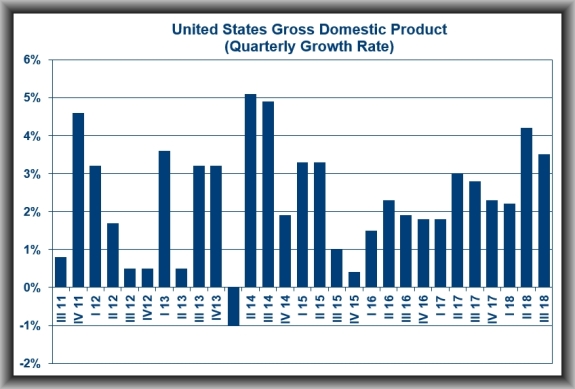
The second estimate for GDP in Q-3 showed economic growth unchanged at an annual rate of 3.5% (I had forecast it to have increased to 3.6%).

Personal consumption expenditures growth was revised down to 3.6% from 4.0% and gross private domestic investment growth was revised up to 15.1% from 12.0%.

Export growth was revised down to -4.4% from -3.5% while import growth was revised up to 9.2% from 9.1%. Net exports subtracted 1.91% from real GDP growth and government spending growth was revised down to 2.6% from 3.3% and contributed 0.44% to real GDP growth.

The takeaway from the report is that real final sales, which exclude the change in inventories, were up just 1.2% – the weakest growth rate since the fourth quarter of 2016.

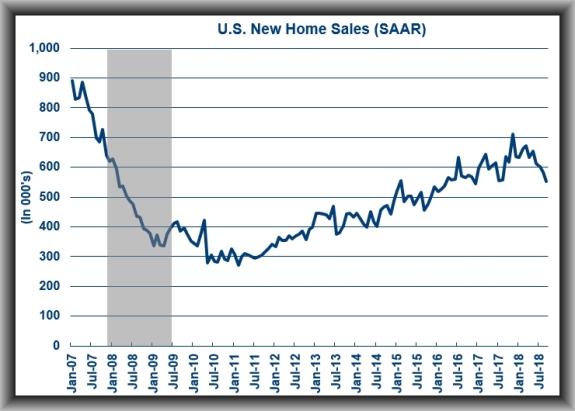
U.S. New Home Sales in October dropped 8.9% to an annual rate of 544,000 as the September figure was revised up to 597,000 (from 553,000).  I had forecast an increase to 575,000.

Regionally, new home sales were down 18.5% month-over-month, and 46.3% year-over-year in the Northeast; down 22.1% month-over-month, and 16.7% year-over-year in the Midwest; down 7.7% month-over-month, and down 11.6% year-over-year in the South; and down 3.2% month-over-month, and down 1.3% year-over-year in the West.

At the October sales pace, there is a 7.4 months’ supply of new homes for sale, which is the highest supply level since January 2011. The increase in supply should presumably be a precursor to lower prices that will crimp profit margins for home builders.

The median sales price in October was down 3.1% year-over-year to $309,700 while the average sales price was up 0.3% to $395,000.  In what is a likely nod to affordability constraints presented by rising mortgage rates, homes priced at $400,000 or more accounted for 28% of new homes sold in October versus 33% in September.

Regardless of the upward revision to September, the takeaway from the report is that the pace of new home sales is weak across all regions and reflects the affordability constraints fueled by rising mortgage rates. The October sales pace is the slowest since March 2016.

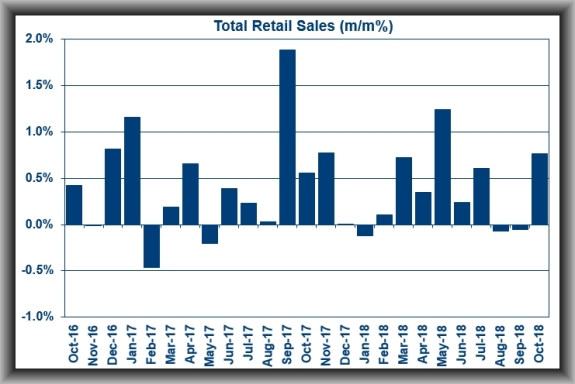
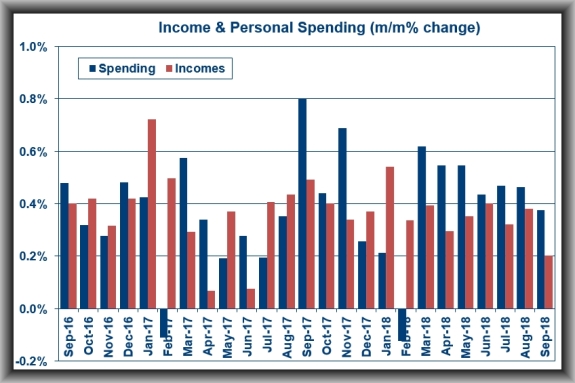
Income & Spending in the U.S. in October showed incomes up by 0.5% (I had forecast 0.4%) and spending up by 0.6% (I had forecast 0.4%).

If there was a drawback on the spending side, it’s that a decent chunk was driven by increased spending for household electricity and gas (i.e. non-discretionary spending).

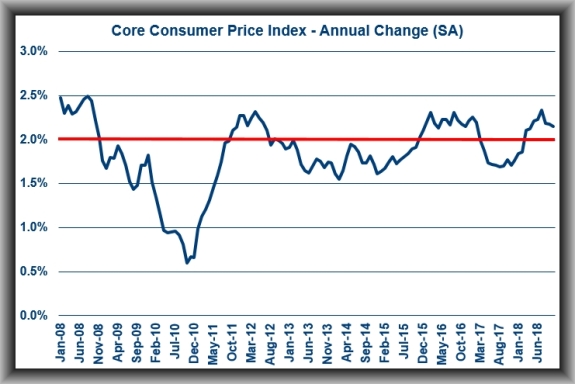
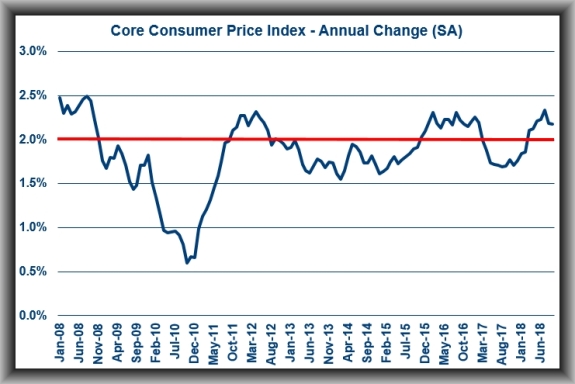
There weren’t any drawbacks on the inflation end of the report – it was tame.  The PCE (Personal Consumption Expenditures) Price Index was up 2.0% year-over-year, unchanged from September, and the core PCE Price Index was up 1.8%, down from 1.9% in September.

The increase in personal income in October was driven by a 0.3% increase in wages and salaries, a 0.4% increase in personal income receipts on assets, and government social benefits to persons.

The tame inflation reading is the primary takeaway from the report since it is supportive of the Federal Reserve taking a more deliberate approach to raising the fed funds rate.

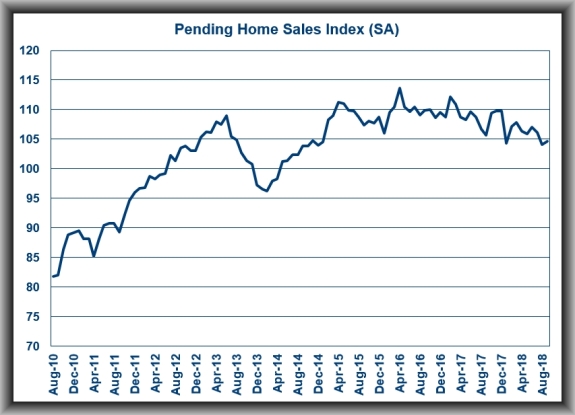
The NAR Pending Home Sales Index for October showed signed contracts down by 2.6% (I had forecast it to have risen by 0.3%).

While all regions saw a decline, pending sales in the West fell furthest, down 8.9%  for the month and down 15.3% compared with a year ago. Sales in the Northeast rose 0.7% for the month and were 2.9% lower annually. In the Midwest, sales fell 1.8% monthly and 4.9% annually. Sales in the South were 1.1% lower monthly and 4.6%  lower than a year ago.

One bright spot in the market is an increase in supply, especially in markets where supply had been tightest and demand highest. Denver, Seattle, San Francisco and San Diego saw some of the largest increases in listings in October, compared with a year ago.

The takeaway of the report is to underscore the challenges as elevated prices and rising mortgage rates are keeping more Americans on the sidelines of the housing market. I consider pending-home sales a leading indicator because they track contract signings; purchases of existing homes are tabulated when a deal closes, typically a month or two later.

While the report is in line with the view that housing isn’t expected to collapse, the industry may have trouble gaining traction. As discussed above, previously-released data on new home sales showed a drop in October to the weakest pace since March 2016, while purchases of previously owned houses rose for the first time in seven months.

What to Watch for This Week

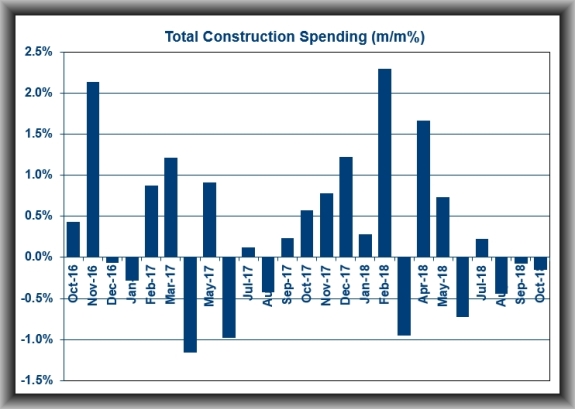
U.S. Construction Spending was little changed in September and I am looking for the October number to be an improvement with total spending up by 0.3%.

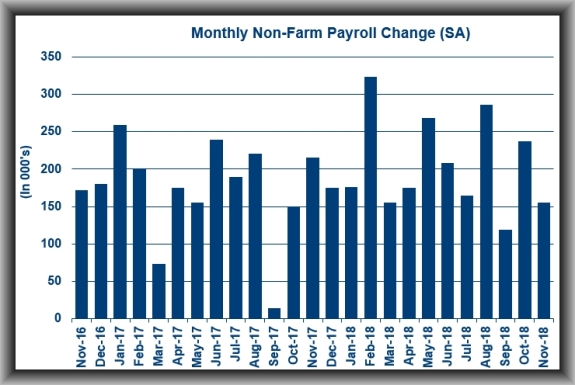
U.S. Non-Farm Payrolls rose by 250,000 on October and the November numbers should show the country having added 185,000 new jobs.

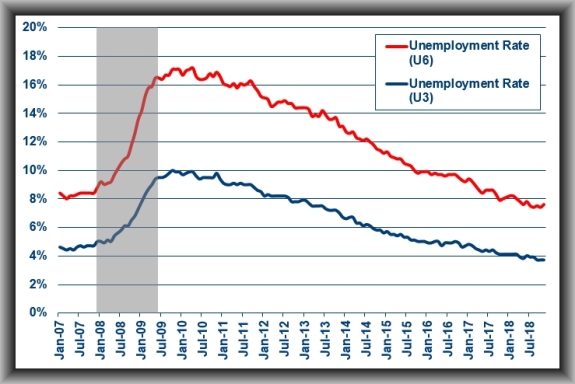
The U.S. Unemployment Rate will remain at 3.7%.

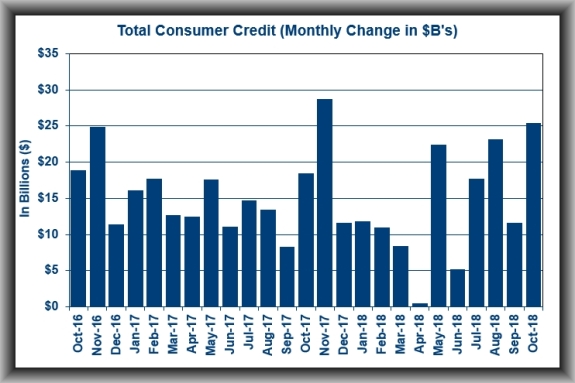
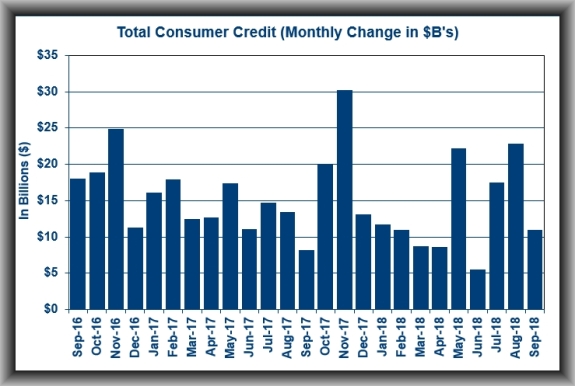
Consumer Credit rose by $11 billion in September and the October figure should show credit expanding by an additional $16.5 billion.

The Weekly Economic & Real Estate Forecast – 11/26/18 to 11/30/18

What I Saw Last Week

U.S. home builder sentiment recorded its steepest one-month drop in over 4-1/2 years in November as rising mortgage rates and tight home inventory squeezed the housing sector.  The NAHB Housing Market Index in November dropped to 60 from 68 after I had forecast a more modest drop to 66.

HMI

The index’s eight-point drop was the biggest monthly decline since a 10-point decrease in February of 2014. The index’s component on current single-family home sales decreased to 67, the lowest since August 2016, from 74 in the prior month.

The gauge on expectations for home sales over the next six-months tumbled to 65, matching the level last seen in May 2016 while the barometer on home builders’ view on prospective buyers declined to 45 from 53 and is at its lowest level since July 2016.

With the prospect of future interest rate hikes in store, builders have clearly adopted a more cautious approach to market conditions and urged policymakers to take note.  Recent policy statements on economic conditions have lacked commentary on housing, even as affordability hits a 10-year low. Given that housing leads the economy, it is clear to me that policymakers need to focus more on residential housing market conditions.

U.S. Housing Starts rose 1.5% in October to a seasonally adjusted annual rate of 1.228 million units – I had forecast an increase to 1.230 million – from an upwardly revised 1.21 million (from 1.201 million) in September.

Starts

Single family starts were down 2.5% year -over-year and were lower across all regions, with the exception of the Northeast (+14.8%), but that happens to be the smallest region for housing starts.  The number of units under construction at the end of the period (1.137 million units) was 1.1% above the third quarter average and will register as a positive input in Q-4 GDP forecasts.

U.S. Building Permits dropped by 0.5% in October to a seasonally adjusted annual rate of 1.263 million – I had forecast an increase to 1.260 million – from an upwardly revised 1.27 million (from 1.241 million) in September.

Permits

Single family permits were up 10.9% in the Northeast and up 0.9% in the South. They were down 2.5% in the Midwest and down 5.5% in the West.

The takeaway from these reports is that there wasn’t any strength in single family permits or starts, which were down 0.6% and 1.8% respectively, month-over-month and down 0.6% and 2.6% year-over-year.  The Housing Starts and Building Permits report might have passed the consensus estimate headline test, certainly when taking revisions into account, yet it isn’t a report that should be seen as assuaging concerns about the softness in housing market activity.  If anything, it plays right into those concerns with the year-over-year declines for total permits (-6.0%) and total starts (-2.9%).

The final Consumer Sentiment number for November ticked down to 97.5 – I had forecast it to have held at the early month figure of 98.3.

Sentiment

The Current Economic Conditions Index declined to 112.3 from 113.2 while the Index of Consumer Expectations dipped to 88.1 from 88.7.

The takeaway from the report is that the modest down-tick was due to changes in sentiment among different income earners. Those in the bottom third of the income distribution curve reported an increase in sentiment while those in the top third of the income distribution curve reported a decrease in sentiment. Of note was that there was no change in sentiment among Democrats and Republicans after the mid-term election.

U.S. Existing Home Sales rose 1.4% month-over-month in October to a seasonally adjusted annual rate of 5.22 million units – I had forecast an increase to 5.20 million units. Notably, the October reading represented the first month-over-month increase in seven months even though total sales were 5.1% lower than the same period a year ago.

EHS

EHS$

The median existing home price for all housing types increased 3.8% year-over-year to $255,400, making for the 80th consecutive month of year-over-year gains. The median existing single-family home price was $257,900, up 4.3% year-over-year.

By region, Median home prices rose 3% in the Northeast to $280,900; rose 2.4% in the Midwest to $197,000; were up 3.8% in the South to $221,600; and rose 1.9% in the West to $382,900.

Sales rose 1.5% in the Northeast; dropped 0.8% in the Midwest; rose 1.9% in the South; and were 2.8% higher in the West.

The inventory of homes for sale at the end of October decreased to 1.85 million units from 1.88 million units and total inventory was up 2.8% from a year ago.

The takeaway from the report is that even with the October increase, the level of sales remains at levels last seen in late 2016 as higher mortgage rates and a limited supply of lower-priced homes weigh on would be home buyers.

What to Watch for This Week

Case Shiller Index figures for September are likely to show the 20-City Index level up by 5.3% year-over-year from the August level of 5.5%

Consumer Confidence in October was measured at 137.9.  Look for the November figure to come in at around 135.5.

The second estimate for GDP in Q-3 should show the economy expanding at an annual rate of 3.6% – up from the initial figure of 3.5%.

U.S. New Home Sales in September were running at an annual rate of 553,000 units. Even with builders’ lower confidence levels, I believe that the October figure will show an increase to 575,000.

Income & Spending in the U.S. in October should show incomes up by 0.4% (from 0.2% in September) and spending also up 0.4% (from 0.4% the prior month).

The NAR Pending Home Sales Index for October should show signed contracts up by 0.3% (from 0.5% in September).

The Weekly Economic & Real Estate Forecast – 11/19/18 to 11/23/18

What I Saw Last Week

Inflation – as measured by the Consumer Price Index – exactly matched my forecast with an increase of 0.3% and the core rate also met my forecast for an increase of 0.2%.

CPI

On a year-over-year basis, the all items index was up 2.5%, versus 2.3% in September, and core CPI was up 2.1% versus 2.2% in September.

A 3.0% increase in the gasoline index was responsible for about one-third of the increase in the all items index while a 0.2% increase in the shelter index and a 2.6% increase in the index for used cars and trucks were drivers of the uptick in the index that excludes food and energy (“core CPI”).

The takeaway from the report is that it points to a firming in consumer inflation, which fits the Federal Reserve’s inclination to raise rates again in December.

U.S. Retail Sales in October rose by 0.8% (I had forecast 0.6%) and core sales up by 0.7% (I had forecast 0.5%).

Retail sales

The only retail categories registering sales declines in October were furniture and home furnishing stores (-0.3%) and food services and drinking places (-0.2%).

The takeaway from the report is that it reflects healthy consumer spending activity that will provide a positive input for Q-4 GDP forecasts. Core retail sales, which exclude auto, gas station, building equipment and materials, and food services sales, jumped 0.3%.

What to Watch for This Week

The NAHB Housing Market Index for November is likely to drop from October’s number of 68 – look for it to come in at 66.

U.S. Housing Starts were running at an annual rate of 1.201 million in September and the October figure is likely to rise to 1.230 million.

U.S. Building Permits in September were measured at an annual rate of 1.260 million and the October figure is likely to show it growing to 1.260 million.

The final Consumer Sentiment number for November is likely to remain at the early month figure of 98.3.

U.S. Existing Home Sales should tick up from the annual rate of 5.15 million seen in September to 5.20 million units.

The Weekly Economic & Real Estate Forecast – 11/12/18 to 11/16/18

What I Saw Last Week

Consumer Credit rose by $11.0 billion in September – below my forecast for an increase of $14.5 billion – after increasing by an upwardly revised $22.8 billion (from $20.1 billion) in August.

cc

The jump in consumer credit was driven entirely by non-revolving credit, which increased by $11.2 billion to $2.909 trillion as revolving credit decreased by $0.3 billion to $1.041 trillion.

The takeaway from the report is that it reflects a deceleration in credit expansion that could contribute to concerns about the U.S. economy hitting/nearing peak growth.

Consumer Sentiment in early November edged down to 98.3 from the final October number of 98.6.  I had forecast a drop to 98.0.

The Current Economic Conditions Index edged up to 113.2 from 113.1 while the Index of Consumer Expectations slipped to 88.7 from 89.3.

Con Sent

The takeaway from the report is that stock market sell-off in October had no real impact on consumer sentiment, which was rooted more in favorable views about income expectations and job growth that are key drivers of consumer spending.

What to Watch for This Week

Inflation – as measured by the Consumer Price Index – rose by 0.1% in September with the core rate up by 0.1%.  The October number is likely to show the total rate rising by 0.3% and the core rate up by 0.2%.

U.S. Retail Sales in September rose by 0.1% with core sales (ex-auto) dropping by 0.1%.  I am looking for the October figures to show total sales rising by 0.6% and core sales up by 0.5%.

The Weekly Economic & Real Estate Forecast – 11/05/18 to 11/09/18

What I Saw Last Week

Income & Spending data for September both exactly matched my forecast for incomes rising by 0.2% and spending was up by 0.4%.

I&S

The jump in personal income was led by a 0.2% increase in wages and salaries and a 0.9% jump in rental income. Those increases were offset somewhat by a 0.8% decline in proprietors’ income.  Meanwhile, real disposable personal income (accounting for inflation) was up 0.1% after increasing 0.2% in August. Real spending (PCE) was up 0.3% after increasing 0.4% in August.

The key takeaway from the report is the recognition that PCE price inflation decelerated to 2.0% year-over-year from 2.2% in August. Core PCE price inflation held steady at 2.0%. The inflation readings are on par with the Federal Reserve’s longer run target, yet they haven’t moved to such a degree that they are going to alter the Federal Reserve’s current policy stance, which involves an expectation for further gradual rate hikes.

Case Shiller Index numbers for August showed the 20-City Index up by 5.5% year-over-year – I had forecast 5.1%.

CS

Following reports that home sales are flat to down, price gains are beginning to moderate. Rising prices may be pricing some potential home buyers out of the market, especially when combined with mortgage rates approaching 5% for 30-year fixed rate loans.

The market is beginning to balance more between supply and demand, following one of the strongest seller’s markets in decades. There is little concern, however, that prices will actually fall, only that the gains will fall back to more normal, historical levels of 3% to 4% annually.

Even as the gains shrink, some local markets continue to show price strength. Las Vegas, San Francisco and Seattle saw the biggest annual gains among the 20-city index.

In August, Las Vegas home prices jumped 13.9% year-over-year, followed by San Francisco with a 10.6% increase and Seattle with a 9.6% gain. Four of the 20 cities reported greater price increases in the year ending August 2018 versus the year ending July 2018.

As you will see from the table above, I have started to look at the change in momentum in price gains.  This looks as the rate of increase over the past 12-months and compares that with the previous 12-month period.  As can be seen, 12 of the 20 cities in the Index are seeing gains slow and Seattle is leading the way with a drop of 3.6%.  I expect that we will see more cities start to slow as we move toward a more balanced market.

Consumer Confidence in October came in at 137.9. I had forecast 140.1.

The Present Situation Index increased from 169.4 to 172.8 while the Expectations Index rose from 112.5 to 114.6.

The takeaway from the report is that strong employment growth continues to underpin favorable consumer attitudes about present-day conditions and the outlook.

U.S. Construction Spending in September remained unchanged – I had forecast total spending up by 0.3% – following an upwardly revised 0.8% increase (from +0.1%) in August.

Total private construction rose 0.3% month-over-month, led by a 0.6% increase in residential spending and a 0.1% increase in non-residential spending. New single-family construction spending fell 0.8%.

Total public construction spending declined 0.9% month-over-month, with almost all of that decline stemming from a 0.8% decline in nonresidential spending. A 1.1% decline in highway and street spending was a key drag.

On a year-over-year basis, private construction spending was up 6.1% while public construction spending was up 11.0%.

The takeaway from the report is the recognition that there was no growth in public construction spending in September.

U.S. Non-Farm Payrolls grew at an impressive rate in October, the labor force participation rate rose, and most importantly, average hourly earnings growth trended higher to 3.1% year-over-year, its strongest pace since April 2009.

October nonfarm payrolls increased by 250,000 (I had forecast a much lower rate of 142,000 because of Hurricane Michael, but that was clearly a non-issue). Over the past three months, job gains have averaged 218,000 per month.

September nonfarm payrolls were revised down to 118,000 from 134,000 while August payrolls were revised up to 286,000 from 270,000.

October average hourly earnings were up 0.2% after increasing an unrevised 0.3% in September. Over the last 12 months, average hourly earnings have risen 3.1%, versus 2.8% for the 12 months ending in September.

The U.S. Unemployment Rate in October met my forecast for it to remain unchanged at 3.7%.

Persons unemployed for 27 weeks or more accounted for 22.5% of the unemployed versus 22.9% in September. The U6 unemployment rate, which accounts for unemployed and underemployed workers, was 7.4% versus 7.5% in September.

The takeaway from the October employment report is that it is consistent with labor market trends that will keep the Federal Reserve on a tightening path.

What to Watch for This Week

Consumer Credit rose by $20.1 billion in August and the September number should show an increase of $14.5 billion.

Consumer Sentiment in early November should come in at 98.0 from the final October figure of 98.6.

The Weekly Economic & Real Estate Forecast – 10/29/18 to 11/02/18

What I Saw Last Week

U.S. New Home Sales in September dropped 5.5% to a seasonally adjusted annual rate of 553,000 – I had forecast an increase to 630,000.

NHS

That was the weakest pace since December 2016 and it followed on the heels of a sharp downward revision for August to 585,000 (from 629,000).

The median sales price of $320,000 was down 3.5% from the year-ago period. The average sales price of $377,200 was down 0.6% from the year-ago period

There was a 7.1 months’ supply of new homes based on the September sales pace. That is the highest supply level since March 2011.

The key takeaway from the report is that it underscores how demand is being impacted by rising mortgage rates. Median and average home prices were both down year-over-year, yet that didn’t seem to provide much of a lift for new home sales.

The NAR Pending Home Sales Index for September rose 0.5% – I had forecast a drop of 0.2%.

PHS

According to the Index, activity broke through in the Midwest and West, where, from August to September, the Index tracked up 1.2% and 4.5%, respectively. Compared to September 2017, however, the Index was lower, down 1.1% in the Midwest and 7.4% in the West.

Meanwhile, in the Northeast, the Index trickled down 0.4% from the month prior, and 2.7% below its level in September 2017. In the South, the Index tumbled 1.4% from the month prior, but was 3.3% above last year’s reading.

The takeaway from this report is that buyers are out there on the sidelines, waiting to jump in once more inventory becomes available and the price is right. When compared to 2000, when the housing market was considered very healthy, home sales figures were roughly equivalent, and the affordability conditions were much lower compared to now. So even though affordability has been falling recently, the demand for housing should remain steady.

The first take on U.S. growth in the third quarter of 2019 showed GDP rising by 3.5% – marginally above my forecast for 3.3%.

GDP

The key takeaway from the report is that real final sales of domestic product (which subtracts the change in private inventories) was up just 1.4% — the weakest growth rate since the fourth quarter of 2016. Additionally, with the largest group of U.S. tariffs hitting in September, we may well see slower growth in the 4th quarter.

The final Consumer Sentiment figure for October was 98.6, down slightly from the preliminary figure of 99.0 – I had forecast no change.

CSI

The Current Economic Conditions Index slipped to 113.1 from the preliminary reading of 114.4 while the Index of Consumer Expectations edged higher to 89.3 from the preliminary reading of 89.1.

The takeaway from the report is that consumer sentiment has not been unduly affected by the stock market sell-off or the jump in interest rates. The outlook for consumers is still rooted in feelings about job security.

What to Watch for This Week

Income & Spending data for September should indicate incomes rising by 0.4% and spending up by 0.5%.

Case Shiller Index numbers for August are likely to show the 20-City Index up by 5.9% year-over-year matching the July figure.

Consumer Confidence in October should be down from the September level of 138.4.  Look for it to come in at 135.8 as concerns over dropping stock prices factor in to the Index.

U.S. Construction Spending rose by 0.2% in August on the back of rising public construction spending. I expect to see the September data show total spending up by another 0.2%.

U.S. Non-Farm Payrolls in October should have risen by 190,000 following the September increase of 134,000.

The national Unemployment Rate in October should remain at 3.7%.


The Weekly Economic & Real Estate Forecast – 10/22/18 to 10/26/18

What I Saw Last Week

U.S. Retail Sales were, again, a disappointment with total sales rising by just 1% and core sales (ex-auto) dropping by 0.1%.  I was looking for total sales to have risen by 0.6% and core sales up by 0.4%.

Retail sales

The weak spots for retail sales in September were food services and drinking places (-1.8%), gasoline stations (-0.8%), department stores (-0.8%), health and personal care stores (-0.3%), and grocery stores (-0.1%). There were some areas of strength, notably, non-store retailers – that includes e-commerce – rose 1.1%, furniture and home furnishing stores were also 1.1% higher, electronics and appliance store sales rose 0.9%, and sales at motor vehicle and parts dealers rose by 0.8%.

The takeaway from the report is that core retail sales, which factor into GDP growth models, have not seen significant growth and this may factor negatively for Q-3 real GDP growth prospects.

Builder confidence in the market for newly-built single-family homes rose one point to 68 in October according to the NAHB Housing Market Index. I was expecting to see no change from the September level.

HMI

Notably, builder confidence levels have held in the high 60’s since June of this year as they continue to see solid housing demand, fueled by a growing economy and a nearly 50-year low for unemployment. Additionally, lumber prices have declined for three straight months from the elevated levels seen earlier this summer and that has also helped to reduce some cost pressures.  That said, builders will need to manage supply-side costs to keep home prices affordable and that is a significant task.

September Housing Starts dropped by 5.3% month-over-month to a seasonally adjusted annual rate of 1.201 million units. I had expected a smaller drop to 1.221 million.

Starts

Single family starts dropped by a more modest 0.9% to 871,000 but there was a significant contraction in multifamily starts that dropped by 15.2% to 330,000.

Total starts were up 29.0% in the Northeast (single-unit down 6.7%); down 14.0% in the Midwest (single-unit up 10.2%); down 13.7% in the South (single-unit down 6.8%); and up 6.6% in the West (single-unit up 7.0%).

The number of units under construction at the end of the period stood at a seasonally adjusted annual rate of 1.129 million. That left the third quarter average at 1.124 million, up less than 0.1% from the second quarter average, so it won’t account for much in terms of a positive input into Q-3 GDP growth forecasts.

U.S. Building Permits were down 0.6% to a seasonally adjusted annual rate of 1.241 million – I had anticipated a slight rise to 1.273 million – although the drop was solely due to a 9.3% decline in permits for buildings with five units or more; single-family permits were up 2.9% to 851,000.

Permits

The takeaway from the September Housing Starts and Building Permits report is that the supply of new homes isn’t picking up fast enough to meet the demand for new homes at more affordable price points. Accordingly, overall home sales activity will continue to be curtailed by affordability constraints.

U.S. Existing Home Sales in September came in at an annual rate of 5.15 million units – I had anticipated a smaller drop to 5.3 million.  This represents the lowest number of sales (on an annualized basis) since November of 2015. Total sales were 4.1% lower than the same period a year ago.

EHS

Existing home sales across regions showed the Northeast down by 2.9%; the Midwest unchanged; the South down by 5.4%; and the West 3.6% lower.

The inventory of homes for sale at the end of September decreased from 1.91 million to 1.88 million. The inventory was up 1.1% from a year ago. Unsold inventory stood at 4.4 months of supply versus 4.3 months in August. This is below the 6.0-month supply typically associated with a more balanced market.

The takeaway from the report is that home sales activity was pressured by the limited supply of lower-priced homes and the affordability constraints presented by higher mortgage rates.

What to Watch for This Week

U.S. New Home Sales rose 3.5% to a seasonally adjusted annual rate of 629,000 in August and I anticipate that the September figure will show a slight increase to 630,000.

The NAR Pending Home Sales Index for September should show a drop of 0.2% as overall sales velocities continue to slow.

The first take on U.S. growth in the third quarter of 2019 should show GDP rising by 3.3% – down from the Q-2 growth rate of 4.2%.

I anticipate that the final Consumer Sentiment figure for October will remain at the early month level of 99.0.

The Weekly Economic & Real Estate Forecast – 10/15/18 to 10/19/18

What I Saw Last Week

Inflation, as measured by the Consumer Price Index, rose by 0.1% with the core rate also up by 0.1% (I had forecast both to have risen by 0.2%).

CPI

The monthly increases left total CPI up by 2.3% year-over-year, versus 2.7% in August, and the core rate up by 2.2%, unchanged from August.

The takeaway from the report is that it helped temper concerns about rising inflation for the time being yet, with total CPI and core CPI both running above the Fed’s long-run inflation target of 2.0%, it still leaves little reason to think the Fed is going to back away from a rate hike in December.

The preliminary Consumer Sentiment number for early October came in at 99.0 from the final September figure of 100.8 – I had forecast a more modest drop to 100.0.

CS

Of note is that there was hardly any overlap in the time interviews for the survey were conducted and the recent sell-off in the stock market, suggesting that the impact of the sharp stock market pullback could register more noticeably in the final reading for October.

The takeaway from the report is that it revealed some budding concerns about inflation crimping real income expectations, which is something to be watched closely considering spending is driven more by income growth than consumer confidence.

What to Watch for This Week

U.S. Retail Sales in August were generally a disappointment with total sales rising by just 1% but core sales rose by 0.3%.  I expect to see significant improvement in the September number that should show total sales rising by 0.6% and core sales (ex-autos) up by 0.4%.

The NAHB Housing Market Index has been steady at 67 for the past two months and I am looking for the October number to stay at the September level.

August Housing Starts rose by 9.2% month over month to a seasonally adjusted annual rate of 1.282 million units. I expect to see that figure pull back to 1.221 million.

U.S. Building Permits dropped 5.7% in August to a seasonally adjusted annual rate of 1.229 million units.  Look for the September number to rise to 1.273 million.

U.S. Existing Home Sales in August were unchanged at a seasonally adjusted annual rate of 5.34 million units. I believe that the September number will show a modest pull back to an annual rate of 5.30 million units.