What I Saw Last Week
U.S. home builder sentiment recorded its steepest one-month drop in over 4-1/2 years in November as rising mortgage rates and tight home inventory squeezed the housing sector. The NAHB Housing Market Index in November dropped to 60 from 68 after I had forecast a more modest drop to 66.
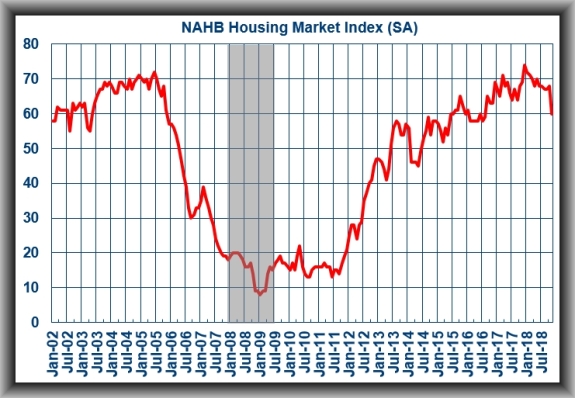
The index’s eight-point drop was the biggest monthly decline since a 10-point decrease in February of 2014. The index’s component on current single-family home sales decreased to 67, the lowest since August 2016, from 74 in the prior month.
The gauge on expectations for home sales over the next six-months tumbled to 65, matching the level last seen in May 2016 while the barometer on home builders’ view on prospective buyers declined to 45 from 53 and is at its lowest level since July 2016.
With the prospect of future interest rate hikes in store, builders have clearly adopted a more cautious approach to market conditions and urged policymakers to take note. Recent policy statements on economic conditions have lacked commentary on housing, even as affordability hits a 10-year low. Given that housing leads the economy, it is clear to me that policymakers need to focus more on residential housing market conditions.
U.S. Housing Starts rose 1.5% in October to a seasonally adjusted annual rate of 1.228 million units – I had forecast an increase to 1.230 million – from an upwardly revised 1.21 million (from 1.201 million) in September.
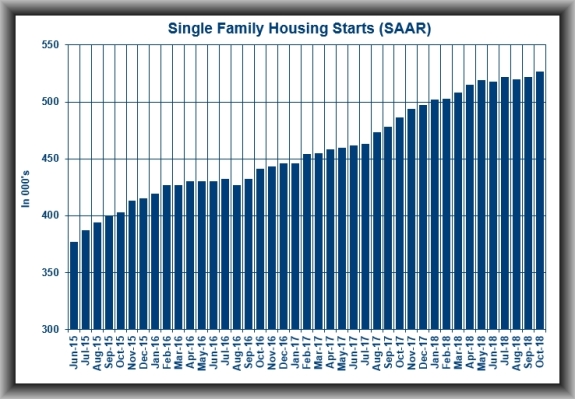
Single family starts were down 2.5% year -over-year and were lower across all regions, with the exception of the Northeast (+14.8%), but that happens to be the smallest region for housing starts. The number of units under construction at the end of the period (1.137 million units) was 1.1% above the third quarter average and will register as a positive input in Q-4 GDP forecasts.
U.S. Building Permits dropped by 0.5% in October to a seasonally adjusted annual rate of 1.263 million – I had forecast an increase to 1.260 million – from an upwardly revised 1.27 million (from 1.241 million) in September.
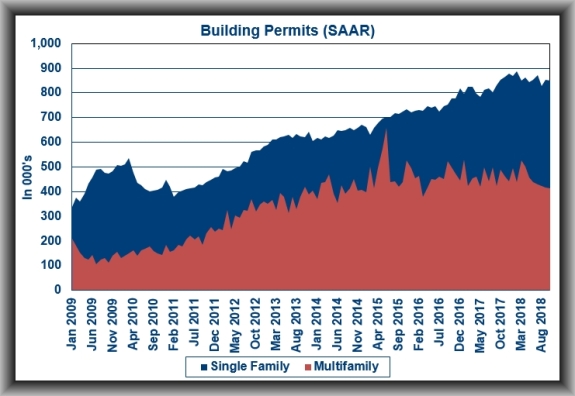
Single family permits were up 10.9% in the Northeast and up 0.9% in the South. They were down 2.5% in the Midwest and down 5.5% in the West.
The takeaway from these reports is that there wasn’t any strength in single family permits or starts, which were down 0.6% and 1.8% respectively, month-over-month and down 0.6% and 2.6% year-over-year. The Housing Starts and Building Permits report might have passed the consensus estimate headline test, certainly when taking revisions into account, yet it isn’t a report that should be seen as assuaging concerns about the softness in housing market activity. If anything, it plays right into those concerns with the year-over-year declines for total permits (-6.0%) and total starts (-2.9%).
The final Consumer Sentiment number for November ticked down to 97.5 – I had forecast it to have held at the early month figure of 98.3.
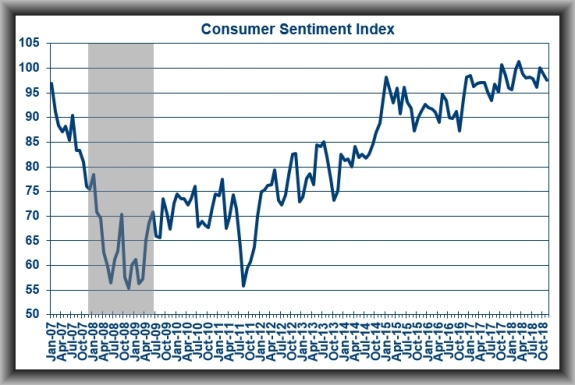
The Current Economic Conditions Index declined to 112.3 from 113.2 while the Index of Consumer Expectations dipped to 88.1 from 88.7.
The takeaway from the report is that the modest down-tick was due to changes in sentiment among different income earners. Those in the bottom third of the income distribution curve reported an increase in sentiment while those in the top third of the income distribution curve reported a decrease in sentiment. Of note was that there was no change in sentiment among Democrats and Republicans after the mid-term election.
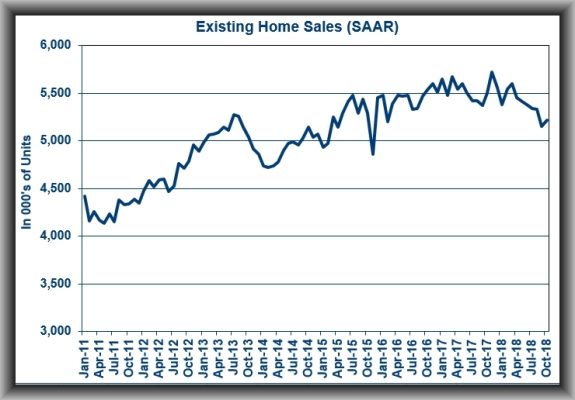
U.S. Existing Home Sales rose 1.4% month-over-month in October to a seasonally adjusted annual rate of 5.22 million units – I had forecast an increase to 5.20 million units. Notably, the October reading represented the first month-over-month increase in seven months even though total sales were 5.1% lower than the same period a year ago.
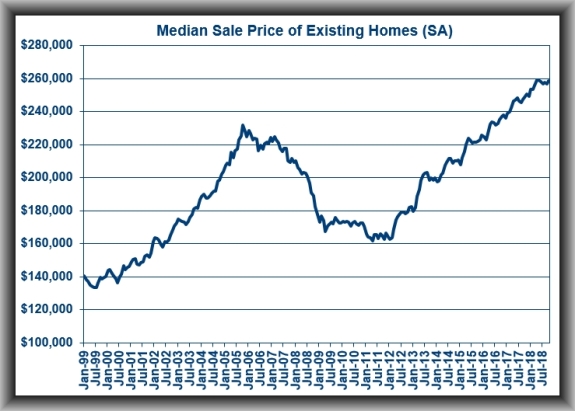
The median existing home price for all housing types increased 3.8% year-over-year to $255,400, making for the 80th consecutive month of year-over-year gains. The median existing single-family home price was $257,900, up 4.3% year-over-year.
By region, Median home prices rose 3% in the Northeast to $280,900; rose 2.4% in the Midwest to $197,000; were up 3.8% in the South to $221,600; and rose 1.9% in the West to $382,900.
Sales rose 1.5% in the Northeast; dropped 0.8% in the Midwest; rose 1.9% in the South; and were 2.8% higher in the West.
The inventory of homes for sale at the end of October decreased to 1.85 million units from 1.88 million units and total inventory was up 2.8% from a year ago.
The takeaway from the report is that even with the October increase, the level of sales remains at levels last seen in late 2016 as higher mortgage rates and a limited supply of lower-priced homes weigh on would be home buyers.
What to Watch for This Week
Case Shiller Index figures for September are likely to show the 20-City Index level up by 5.3% year-over-year from the August level of 5.5%
Consumer Confidence in October was measured at 137.9. Look for the November figure to come in at around 135.5.
The second estimate for GDP in Q-3 should show the economy expanding at an annual rate of 3.6% – up from the initial figure of 3.5%.
U.S. New Home Sales in September were running at an annual rate of 553,000 units. Even with builders’ lower confidence levels, I believe that the October figure will show an increase to 575,000.
Income & Spending in the U.S. in October should show incomes up by 0.4% (from 0.2% in September) and spending also up 0.4% (from 0.4% the prior month).
The NAR Pending Home Sales Index for October should show signed contracts up by 0.3% (from 0.5% in September).
