What I Saw Last Week
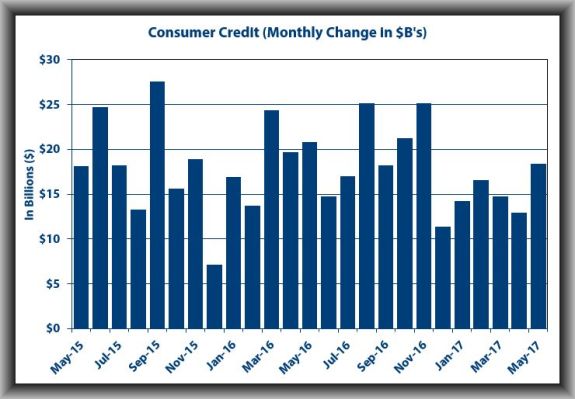
Consumer Credit rose by $18.4B in May (I had forecast $12.7B) after increasing by an upwardly revised $12.9B (from $8.1B) in April.

The growth in May was driven by a double-dose expansion in non-revolving credit, which was up $11.1B from April to $2.824T, and revolving credit, which increased by $7.3B to $1.019T.
Consumer credit increased at a seasonally adjusted annual rate of 5.75% in May, with revolving credit increasing at an annual rate of 8.75% and non-revolving credit increasing at an annual rate of 4.75%.
Provided consumers weren’t making greater use of revolving credit lines to cover basic needs due to a shortfall in income, this report can ostensibly be looked upon as a good sign for the economy since the expansion of credit is an integral contributor to economic growth. It is hard to say, though, because there isn’t enough detail in the report and it tends to be subject to large revisions, which is why the market rarely shows much reaction to it.
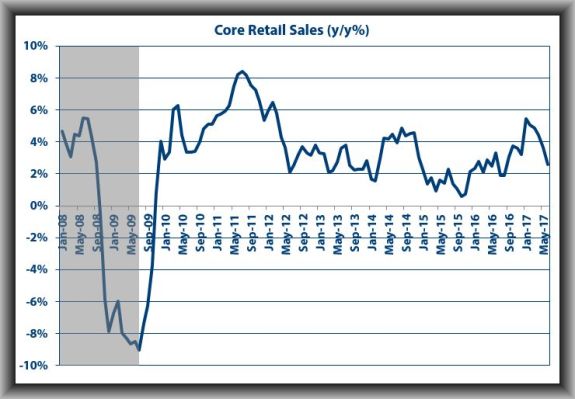
U.S. Retail Sales declined 0.2% (I had forecast +0.1%) on the back of an upwardly revised 0.1% decline (from -0.3%) for May while core sales, excluding autos, fell 0.2% after an unrevised 0.3% decline for May.

A 1.3% drop in gasoline station sales was the main drag on total retail sales along with a 0.6% decline in sales at food services and drinking places and a 0.4% decline in sales at food and beverage stores.
Building material, garden equipment and supplies dealers (+0.5%), general merchandise stores (+0.4%), and non-store retailers (+0.4%) were among the pockets of retail sales strength in June.
Core retail sales is the component that factors into the PCE goods component of the GDP report, so the takeaway from the retail sales data is that it points to weak spending on consumer goods in June and will be a negative input for Q2 GDP models.
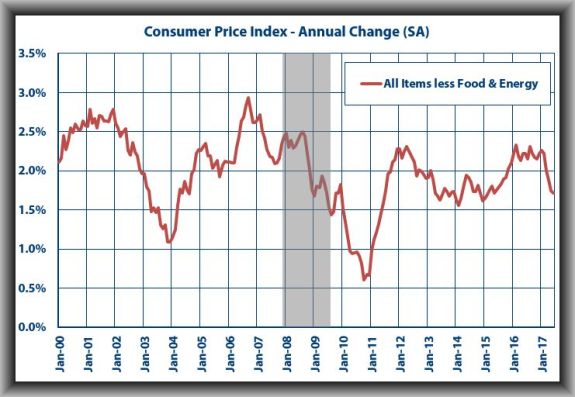
Inflation, as measured by the Consumer Price Index, was unchanged in June, as I had forecast, while core CPI, which excludes food and energy, rose by 0.1%.

These monthly readings left CPI up 1.6% year-over-year, versus up 1.9% in May, and core CPI up 1.7% year-over-year, which was unchanged from the 12-month period ending in May.
The takeaway from this report is that the trend of disinflation for the Consumer Price Index, which began in March, remained intact and will force the Fed to take more time to determine if it ultimately flows through and undercuts the stable trend in core CPI.
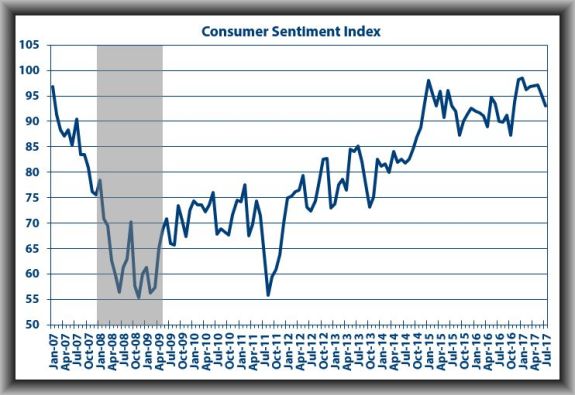
Consumer Sentiment in early July came in at 93.1 – I had forecast it to have remained at 95.1.

The Current Economic Conditions Index climbed from 112.5 in June to 113.2 in July, matching the March 2017 peak for this index.
The Index of Consumer Expectations fell from 83.9 in June to 80.2 in July, which is ten points below its January 2017 peak.
It was noted in the report that the data does not suggest an impending recession, as much steeper declines in expectations typically precede an economic contraction. The report also stipulated that the overall data indicates an annual gain of 2.4% in personal consumption in 2017.
The takeaway from the report is that it is fitting a pattern seen around past cyclical peaks, whereby the assessment of current conditions hits new peaks at the same time expectations start to post significant declines.
What to Watch for This Week
The NAHB Housing Market Index was measured at 67 in June and the July number is likely to stay at the prior month’s level.
U.S. Building Permits were running at an annual rate of 1.168M units in May. The June figure should show a modest bump to 1.196M.
U.S. Housing Starts were measured at an annual rate of 1.092M in May and the June figure will be higher. Look for 1.160M units.